Startup Metrics That Matter: What Investors Actually Look For
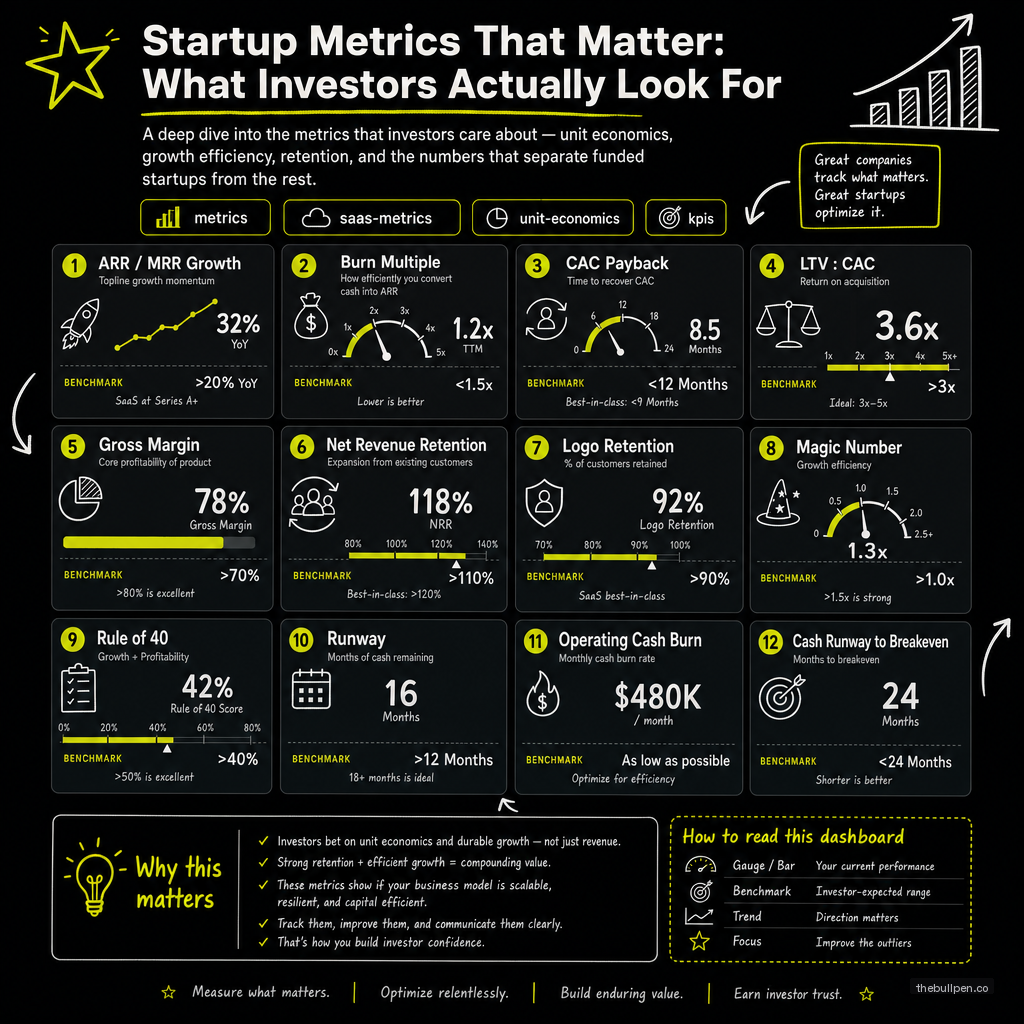
A deep dive into the metrics that investors care about — unit economics, growth efficiency, retention, and the numbers that separate funded startups from the rest.
Founders love building dashboards. They obsess over every data point, build elaborate visualizations, and track 47 metrics in real-time. Then they sit down with an investor and realize they've been tracking the wrong numbers. The metrics that founders find interesting and the metrics that investors find convincing are rarely the same set.
Investors care about a surprisingly small set of metrics. If you nail these, everything else is supporting detail. This guide breaks down exactly what matters at each stage, what the benchmarks are, and how to present your numbers in a way that builds conviction — not confusion.
Revenue Metrics: The Foundation
Revenue is the most transparent signal of value creation. It's also the most easily manipulated. Smart investors know the difference between real revenue and accounting theater, and they'll ask the questions that reveal which one you're reporting.
MRR and ARR
Monthly Recurring Revenue and Annual Recurring Revenue are the baseline of any SaaS investor conversation. But investors look beyond the top-line number. They want to know how your MRR is composed: how much is new business, how much is expansion from existing customers, how much is contraction, how much is lost to churn, and how much is reactivation of previously churned customers.
MRR should be broken into five components: new MRR (from new customers), expansion MRR (upsells and cross-sells), contraction MRR (downgrades), churn MRR (lost customers), and reactivation MRR (win-backs). The ratio of new + expansion to contraction + churn tells an investor whether your business is getting healthier or struggling. A ratio above 2:1 is strong. Below 1:1 is a warning sign.
Related: MRR and ARR: The Complete Guide
Growth Rate
Month-over-month revenue growth rate is the single most predictive metric for early-stage SaaS companies. It correlates more strongly with long-term success than any other metric at the seed stage. The Rule of 40 (growth rate + profit margin ≥ 40%) becomes relevant at scale, but at the seed and early Series A stage, pure growth rate dominates.
Targets by stage: Pre-seed stage expects 20%+ MoM growth. Seed expects 15%+ MoM. Series A expects 10%+ MoM. Late stage expects 5%+ MoM. Anything below 5% MoM at any stage and you're a lifestyle business, not a venture-backable company. These are not arbitrary numbers — they're the growth rates that produce venture-scale returns within a fund's 10-year lifecycle.
Related: Month-Over-Month Growth: What's Good?
Committed vs. Booked Revenue
Committed revenue is under contract — signed, sealed, billing started. Booked revenue is in the pipeline but not yet signed — verbal commitments, proposals outstanding, negotiations in progress. Smart investors ask for both and look at the ratio.
A high committed-to-booked ratio means predictable revenue and strong sales execution. A low ratio means you're forecasting into thin air. Companies that conflate these two categories lose credibility fast when an investor asks the follow-up questions.
Related: Committed vs. Booked Revenue (Coming soon — November 28, 2026)
Unit Economics: The Engine Room
Unit economics tell you whether each customer is profitable to acquire and serve. Without positive unit economics, growth just accelerates losses — and investors know this.
Customer Acquisition Cost (CAC)
How much does it cost to acquire a customer? Not just the ad spend — the fully loaded cost including sales salaries, marketing spend, tools and software, content production, overhead allocation, and any third-party services. If your sales team spends 40 hours chasing a $500/month deal, that's a $400 customer at a $5,000 cost.
Early-stage CAC benchmarks: Self-serve PLG products: $50-$500 per customer. Outbound sales for mid-market: $5,000-$20,000. Enterprise sales: $20,000-$100,000+. The raw number matters less than the ratio to LTV and the payback period.
Related: Customer Acquisition Cost: A Complete Guide
Lifetime Value (LTV)
How much gross profit a customer generates over their entire relationship with you. Note: gross profit, not total revenue. If your COGS is 30% and a customer generates $1,000 in revenue, your LTV contribution from that revenue is $700.
The formula: LTV = ARPU × Gross Margin ÷ Churn Rate. Simple in theory, tricky in practice. Most founders make the mistake of using average churn instead of cohort-based churn. Average churn hides the fact that early-stage churn is usually much higher than mature customer churn, leading to over-optimistic LTV estimates.
Related: LTV Calculation for SaaS
LTV:CAC Ratio
This is the single most important unit economics metric. A ratio above 3x means you're generating $3 of lifetime value for every $1 spent acquiring customers. Above 5x is exceptional. Below 1x means you're losing money on every customer — fix pricing, reduce acquisition costs, or both before scaling.
Benchmarks for SaaS: Top-quartile companies have LTV:CAC of 5-7x. Median companies hit 3-4x. Companies below 3x need to improve their unit economics before raising growth capital. Investors at Series A will ask for this number specifically.
Related: LTV:CAC Ratio: What's Healthy?
CAC Payback Period
How many months does it take to earn back what you spent acquiring a customer? Under 12 months is excellent. 12-18 months is standard for SaaS. Over 24 months indicates a structural problem — either your CAC is too high, your pricing is too low, or your retention is too weak.
Companies targeting $1M+ ARR should aim for CAC payback under 12 months. Anything above 18 months requires a capital-efficient growth strategy or a very patient investor base.
Related: CAC Payback Period and Revenue Model, Payback Period in SaaS
Gross Margin
SaaS gross margins should be 70-85%. Below 60% means your product has a unit economics problem — likely infrastructure costs that are too high, services-heavy delivery that masks as product revenue, or inefficient pricing. Low gross margins compound over time, making every dollar of growth less valuable and every dollar of churn more painful.
Professional services gross margins (implementation, consulting, custom work) run 30-50%. If services make up a significant portion of your revenue, report them separately from product revenue. Conflating the two is a red flag for sophisticated investors.
Related: Gross Margin in SaaS
Retention and Churn: The Growth Multiplier
Retention is the most predictive metric for long-term success. High-retention companies compound. Low-retention companies treadmill — they need constant new customer acquisition just to stay flat.
Logo Churn vs. Revenue Churn
Logo churn (customer churn rate) tells you how many customers you're losing as a percentage. Revenue churn tells you how much revenue you're losing. These numbers diverge when you lose many small customers but retain your big ones, or vice versa.
High logo churn with low revenue churn means your lower-priced tiers aren't sticky. This is fixable with better onboarding or product improvements. Low logo churn with high revenue churn means your biggest customers are leaving — a much more dangerous signal that suggests core product issues at the enterprise level.
Related: Logo Churn vs. Revenue Churn: What's the Difference?
Net Revenue Retention (NRR)
NRR measures whether existing customers are growing or shrinking over time. Above 100% means expansion revenue from existing customers covers the revenue lost to churn and contraction. Above 120% is elite. Below 100% means you're on a treadmill — you need constant new customer acquisition just to maintain revenue.
NRR is the closest thing to a single metric that captures product-market fit. High NRR companies have pricing power, effective land-and-expand strategies, and products that become more valuable the longer customers use them.
Related: Net Revenue Retention: The Complete Guide
Gross Revenue Retention (GRR)
GRR ignores expansion and measures only retained revenue from the existing base. Usually 80-95% for good SaaS. Below 80% means your product has a fundamental stickiness problem that expansion revenue alone cannot fix.
The gap between GRR and NRR tells an investor how much of your growth depends on expansion vs. pure retention. A wide gap (85% GRR and 130% NRR) means you're good at upselling but have leaky buckets — fix the retention before the expansion game gets harder.
Related: Gross Revenue Retention vs. Net Revenue Retention (Coming soon — January 4, 2027)
Churn Curves
Churn is not constant over time. Most software products experience high early churn (first 30-90 days) that stabilizes significantly after the first quarter. Plotting churn by customer cohort age reveals the real picture.
If churn stays flat across time cohorts, you have a product problem — customers never find enough value to stay. If churn drops sharply after the first 90 days and stabilizes, you have an onboarding problem. Each requires a different fix.
Related: Churn Curves and Retention Analysis (Coming soon — October 17, 2026), Churn Rate Deep Dive (Coming soon — October 11, 2026)
Growth Efficiency Metrics
Growth is great. Profitable growth is better. These metrics tell investors if you're growing efficiently or burning cash.
Burn Multiple
Net cash burn divided by net new ARR added in the same period. A burn multiple of 1x means you're burning $1 for every $1 of new ARR. Under 1.5x is good for growth-stage companies. Under 1x is excellent. Above 3x and you're burning cash faster than you're building value.
Late-stage investors scrutinize burn multiple more than any other efficiency metric. A high burn multiple combined with slowing growth is the classic pattern that precedes down rounds and restructuring.
Related: Burn Multiple in SaaS: What's Healthy?
SaaS Magic Number
(Current quarter's new ARR × 4) ÷ Previous quarter's sales and marketing spend. A magic number above 1.0 means efficient go-to-market. Below 0.5 means you're overspending on acquisition relative to the revenue you're generating.
The magic number is a lagging indicator but a powerful one. Track it quarterly. The trend direction matters more than any single data point.
Related: SaaS Magic Number Explained
Rule of 40
Growth rate + profit margin ≥ 40. This is the gold standard for mature SaaS companies. At the seed stage, you'll be well below 40 (sacrificing profit for growth). By Series B, you should be approaching it.
A 30% growth rate combined with a 10% profit margin equals 40. A 50% growth rate with a -30% profit margin equals 20 — not great. Growth without efficiency eventually catches up.
Related: Rule of 40 in SaaS
Engagement and Product Metrics
Before you have meaningful revenue, engagement is your proxy for product-market fit.
DAU/MAU Ratio
Above 20% is good. Above 50% is world-class (think Slack, Notion, social media). Below 10% and your product is a once-in-a-while utility, not a daily habit.
Context matters enormously. An ERP system with 5% DAU/MAU might be perfectly fine — people use it when they need it. A consumer social app with 5% DAU/MAU is dying. Know your category benchmarks.
Related: DAU/MAU and Engagement Metrics (Coming soon — August 30, 2026)
Activation Rate
The percentage of new users who reach the "aha moment" — the point where they experience your product's core value. For Slack, it's sending 2,000 messages. For Dropbox, it's saving the first file. For your product, it's the specific action that correlates with long-term retention.
Improving activation by 10% compounds dramatically. A product that activates 30% of new users instead of 20% doesn't just get 50% more retained users — it gets 50% more word-of-mouth, 50% more referrals, and 50% more expansion revenue over time.
Related: Activation Rate in SaaS (Coming soon — August 18, 2026)
Time to Value (TTV)
Hours is ideal. Days is good. Weeks means you need better onboarding. Months means you'll lose most users before they experience value. TTV is the single best leading indicator of early-stage churn.
Cohort Analysis: The Truth-Teller
Averages lie. Cohort analysis reveals the truth about your business.
Why Cohorts Matter
A cohort is a group of customers who signed up in the same period. Tracking each cohort's retention, revenue, and engagement over time reveals whether your product is improving, staying flat, or degrading.
If each new cohort retains at the same rate as previous cohorts, your product-market fit is stable. If each new cohort retains worse, your quality or targeting is degrading. If each new cohort retains better, you're improving — and your future is brighter than your past suggests.
Related: Cohort Analysis Guide for Startups (Coming soon — October 23, 2026)
Acquisition Channel Cohorts
Track cohorts separately by acquisition channel. Paid ads, organic search, referrals, content marketing, and direct sales each produce different retention curves. A channel with high volume but low retention is a trap. A channel with lower volume but high retention is a foundation to build on.
Related: Acquisition Channel Cohorts (Coming soon — October 29, 2026)
Metrics by Investor Stage
What matters most changes as your company grows.
Pre-Seed
Active users, engagement depth, waitlist size and conversion, prototype validation, and team credentials. Investors at this stage are betting on the founder, not the metrics. But clean data on user behavior helps them justify the bet.
Seed
$10K-$50K MRR with 15%+ MoM growth. Gross margin above 70%. Early retention data from the first 90-day cohort. Customer acquisition cost with at least directional accuracy.
Related: SaaS Metrics for Fundraising (Coming soon — October 22, 2026)
Series A
$1M-$3M ARR with 10%+ MoM growth. NRR above 100%. LTV:CAC above 3x. Gross margin above 75%. Cohort stability across 6+ months of data. Proven repeatable GTM.
Related: Metrics Dashboard for Investors (Coming soon — January 20, 2027), Investor Data Room (Coming soon — September 17, 2026)
FAQ
What's the one metric I should track above all others?
At seed stage: month-over-month revenue growth. At growth stage: net revenue retention. Everything else supports these two. If you're not growing fast enough, no other metric matters. If you're growing but can't retain, you're building on sand.
How do I know if my metrics are good enough to raise?
Compare against benchmarks for your stage. Seed: $10K+ MRR, 15%+ MoM growth, >70% gross margin. Series A: $1M+ ARR, 10%+ MoM growth, >100% NRR. Below these, focus on improving before fundraising.
Should I track GAAP or non-GAAP metrics?
Both. Use GAAP for formal investor reporting and non-GAAP for internal decision-making. Be clear about which is which and consistent in definitions. Changing metric definitions between meetings destroys credibility.
What metric red flags do investors look for?
High churn masked by gross retention instead of net retention. Deteriorating cohort performance. Vanity metrics like "total registered users." CAC that ignores fully loaded costs. Metrics that don't tell a consistent story.
Related: Metrics Red Flags Investors Look For (Coming soon — September 23, 2026)
How often should I update my metrics dashboard?
Weekly for operational metrics (MRR, cash, burn). Monthly for unit economics and cohort analysis. Quarterly for strategic metrics (NRR, magic number, Rule of 40). Daily tracking of everything is a distraction from building.
Stop guessing if your metrics are investor-ready. Upload your deck or financials to Bullpen for a free AI-powered evaluation. Get a detailed breakdown across 7 categories — including metric clarity, unit economics, and growth trajectory — before you step into a pitch meeting.
Get weekly pitch tips
One email a week. Actionable advice for founders.
Benchmark your metrics against investor expectations. Try now →