Complete Guide to Customer Acquisition Cost (CAC)
Deep-dive into calculating CAC across channels — what to include, what to exclude, what healthy looks like by stage, and the mistakes that make investors question your numbers.
Founders love telling me their CAC. It's always a nice round number, usually under $100, and they're always proud of it.
Then I ask them to walk through how they calculated it, and the number starts falling apart. They forgot to include salaries. They left out the tools. They divided by total users instead of paying customers. They averaged six months of data when the real cost only started making sense in month four.
Your CAC number is only as useful as the calculation behind it. A wrong CAC is worse than no CAC, because it tells you the wrong thing to do. Scale the wrong channel and you're just burning faster.
Related: Startup Metrics That Matter: What Investors Actually Look For
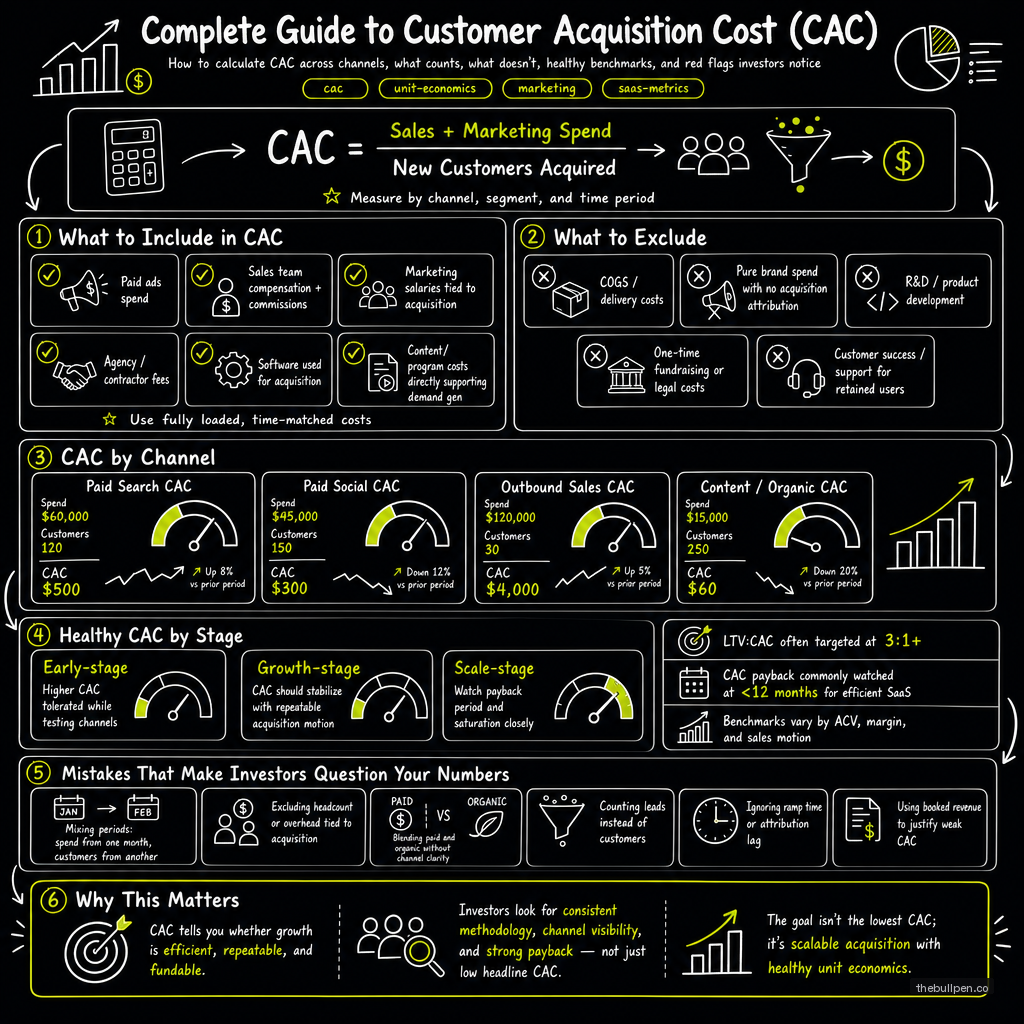
What CAC Actually Costs
The range across SaaS is enormous, and the business model determines where you land.
Self-serve products — the PLG path, where users sign up and pay without ever talking to a human — have the lowest CAC. You're spending on ads, content, and product-led channels, not sales salaries. The range runs from about $50 to $500 per customer. The low end is organic growth and virality. The high end is paid acquisition in competitive categories.
Outbound sales for mid-market land very differently. You have sales development reps, account executives, demo software, CRM tools, content marketing, and a fully loaded cost structure. The range is $5,000 to $20,000 per customer. That sounds expensive until you realize the annual contract value is $50,000.
Enterprise sales sit at $20,000 to $100,000-plus per customer. These deals involve multiple stakeholders, proof-of-concept phases, legal reviews, and security questionnaires. A six-month sales cycle with three people salary-loaded is expensive. But a $500,000 ACV deal supports that cost structure easily.
The mistake founders make is applying the wrong benchmark to their business. If you're building a $10/month self-serve product and comparing yourself to enterprise SaaS benchmarks, you'll either feel falsely confident or falsely panicked. Know your model, benchmark against it, and ignore everything else.
Related: CAC Payback Period and Revenue Model
The Ratio That Matters More Than the Raw Number
Raw CAC is nearly meaningless without context. A $10,000 CAC is excellent if your customer stays for four years at $15,000 a year. It's catastrophic if your customer pays $500 once and churns.
Investors look at two ratios that put CAC in context.
The CAC payback period is how many months it takes to earn back what you spent acquiring the customer. Under 12 months is excellent. Twelve to 18 months is standard for SaaS. Anything over 24 months means something structural is wrong — your pricing is too low, your acquisition costs are too high, or your retention is too weak.
The LTV:CAC ratio is the headline metric. Above 3x means you're generating $3 of lifetime value for every dollar spent acquiring customers. Above 5x is top-quartile. Below 3x means an investor will ask hard questions about your unit economics. Below 1x means you lose money on every customer — which some companies tolerate intentionally during land-and-expand phases, but only with a clear path to expansion revenue that changes the math.
According to KeyBanc Capital Markets' annual SaaS survey (formerly the Pacific Crest survey), the median SaaS company has an LTV:CAC ratio of roughly 3.5x. The top quartile clears 5x. If you're below 2x and growing, you're buying revenue. That's a strategy, not a problem, as long as you know that's what you're doing.
Related: The LTV:CAC Ratio and Why It Makes or Breaks Your Fundraising
What Founders Get Wrong
I've seen the same CAC mistakes in pitch decks from founders raising everything from pre-seed to Series A.
Blended CAC hides everything. Most founders report a single blended CAC number. That number is useless because it averages your most efficient channel with your least efficient one. The right approach is channel-level CAC: CAC from paid search, CAC from content, CAC from outbound, CAC from referrals. When you see a $200 blended CAC, you don't know if you have a $50 channel and a $350 channel or five channels all at $200. Those two scenarios demand completely different strategies.
Not fully loading the cost. CAC is not ad spend divided by customers. It's the fully loaded cost: salaries, benefits, tools, software subscriptions, content production, agency fees, overhead allocation, and third-party services. If your marketing team uses five tools at $200 each and produces 30 pieces of content a month, those costs are part of CAC. Most founders under-count by 30 to 50 percent.
Using the wrong time window. If you started paying for ads last month and got your first three customers, dividing last month's spend by three gives you a number that means nothing. CAC only stabilizes once you have enough data — typically 90 to 180 days of consistent spend. Month-one CAC is always misleading. Show the six-month trend, not the single-month snapshot.
Confusing paid and organic. Organic customers have near-zero acquisition cost, and including them in your blended CAC makes paid channels look more efficient than they are. Separate them. If you can't survive without paid acquisition, you need to know what that channel costs on its own.
Related: Payback Period in SaaS: A Complete Guide
How Investors Evaluate Your CAC
When an investor looks at your CAC slide, they're not checking whether the number is low. They're checking whether the number is honest.
The first thing they do is sanity-check against your business model. A $500 CAC on a $20/month product doesn't make sense unless you have absurdly low churn. A $20,000 CAC on a $1,000/month product is a death spiral unless you have a massive expansion play.
The second thing they do is compare your payback period to your burn rate. If it takes 18 months to pay back a customer and you have 12 months of runway, the math doesn't work. You'll run out of money before your customers pay for themselves, which means you need to raise again before you have the metrics to justify it.
The third thing they look for is trend direction. Is CAC going up or down over the last six months? Going down means your channels are maturing, your content is compounding, and your unit economics are improving. Going up means competition is intensifying, channels are saturating, or you're buying worse leads. Both are information. The problem is not knowing which one you're in.
Data references: KeyBanc Capital Markets 2023 SaaS Survey (median LTV:CAC ~3.5x, top-quartile 5x+). SaaStr annual CAC benchmarks across self-serve, mid-market, and enterprise. General SaaS industry ranges from Pacific Crest/KeyBanc surveys and OpenView SaaS benchmarks.
Want to see how investors would evaluate your unit economics? Upload your deck to Bullpen for a free AI-powered assessment across 7 investor categories.
Get weekly pitch tips
One email a week. Actionable advice for founders.
Benchmark your metrics against investor expectations. Try now →