LTV:CAC Ratio: The Metric Investors Check First
The LTV:CAC ratio is the single most important unit economics metric in your pitch deck. Here's what healthy looks like by stage, what the benchmarks actually say, and why most founders calculate it wrong.
Investors flip to the unit economics slide first. Not the team slide, not the market size slide, not the product screenshot. The unit economics slide. And on that slide, there is one number that gets more scrutiny than any other: the LTV:CAC ratio.
It makes sense when you think about it from the investor's perspective. Your team changes. Your market evolves. Your product gets redesigned. But your unit economics — the fundamental math of whether each customer is worth more than it costs to acquire them — that is the most durable signal of whether your business actually works.
If the ratio is strong, everything else is negotiable. If it's weak, nothing else matters.
Related: Startup Metrics That Matter: What Investors Actually Look For
What the Number Actually Means
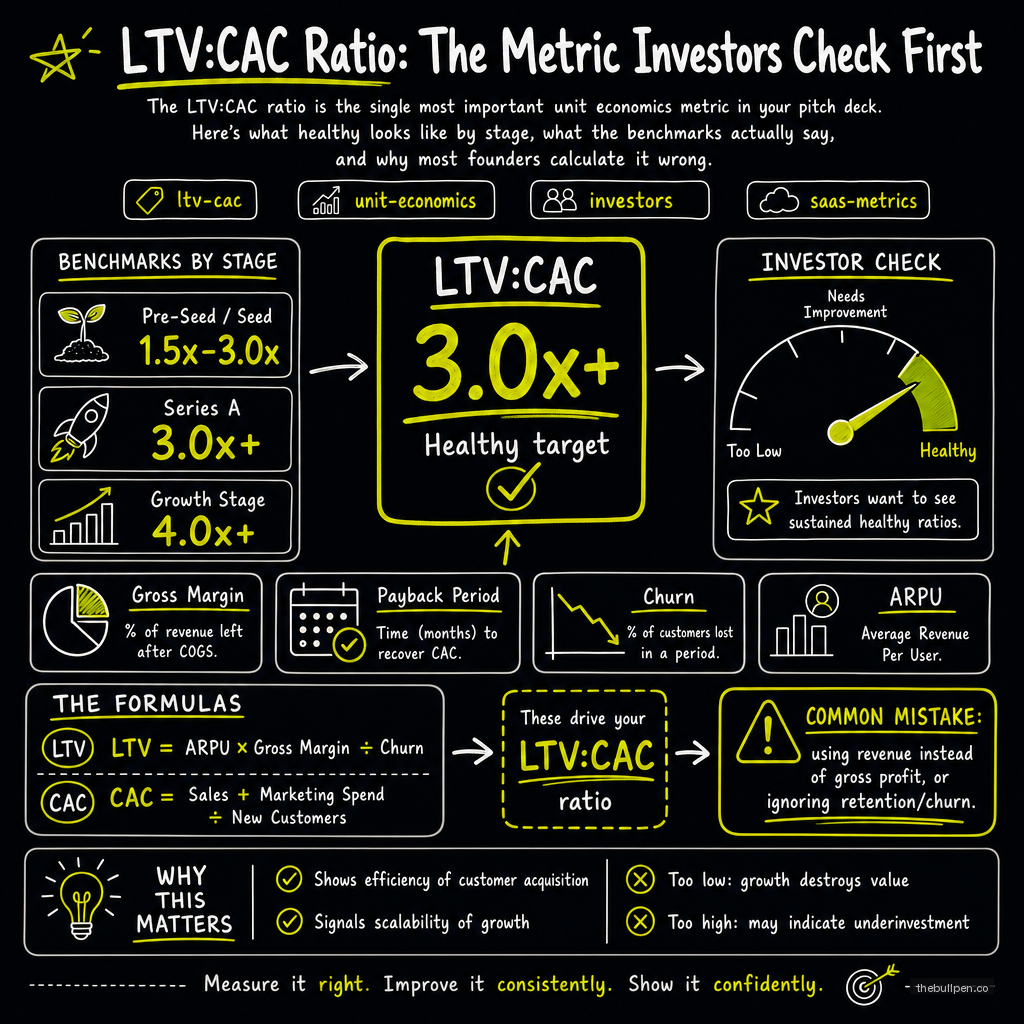
The LTV:CAC ratio tells you how many dollars of lifetime value you generate for every dollar spent acquiring a customer. A 3x ratio means you get $3 back for every $1 you spend. A 5x ratio means $5 back. A 1x ratio means you break even — which sounds fine until you remember that you have to pay all your operating costs out of what's left.
The math is simple but the benchmarks are specific. KeyBanc Capital Markets' 2022 SaaS Survey of 200 companies found a median LTV:CAC of 3.6 to 1. The top quartile hit 5.1 to 1 and above. The bottom quartile was below 2.2 to 1. Pacific Crest's earlier survey found similar medians around 3.5 to 1, and OpenView's data put the top quartile at 7 to 1.
| Ratio | Assessment | What Investors Think |
|---|---|---|
| Below 1.0x | Unsustainable | "You lose money on every customer" |
| 1.0x – 3.0x | Needs work | "Good story, but can you fix the math?" |
| 3.0x – 5.0x | Healthy | "Solid business, let's talk" |
| 5.0x+ | Excellent | "How fast can you scale this?" |
Companies below 1x are in dangerous territory. They lose money on every customer they acquire, which means growth just accelerates losses. Some businesses intentionally operate here during land-and-expand phases — they lose money upfront on a small deal, knowing the customer will expand to 5x the initial contract value within a year. But that only works if the expansion math is real and the timeline is short.
Companies in the 1x to 3x range need to improve before scaling. The business isn't broken, but it has a unit economics problem that will compound as you grow. The fix usually involves pricing, retention, or channel efficiency — sometimes all three.
Related: Lifetime Value: How to Calculate and Improve LTV
Why Most Founders Get It Wrong
The LTV:CAC ratio seems straightforward, but I've seen it calculated five different ways in the same pitch deck. The variation comes from the inputs, not the formula.
The most common mistake: including non-recurring revenue in LTV. Setup fees, implementation charges, and one-time professional services inflate the numerator. If your LTV is $10,000 but $3,000 of that comes from a one-time implementation fee, your real recurring LTV is $7,000. The ratio drops from 4x to 2.8x. That's the difference between "fundable" and "come back later."
The second most common mistake: using average churn instead of cohort churn. The LTV article covers this in detail, but the short version is that average churn hides the fact that early-stage churn is much higher than mature churn. Using average churn overstates LTV by 30 to 50 percent.
The third mistake: forgetting to gross-margin-adjust the CAC side. If your sales and marketing spend includes fully loaded costs — salaries, tools, overhead — but your LTV uses only ad spend, the ratio is apples-to-oranges. Both sides need to be fully loaded or neither is honest.
Related: Complete Guide to Customer Acquisition Cost
How the Ratio Changes by Stage
The expected LTV:CAC ratio depends on where you are. Pre-seed investors care less about the ratio because you don't have enough data. Seed investors want to see it trending in the right direction. Series A investors expect it to be at or above 3x. Series B and beyond want to see it improving — if your ratio is getting worse as you scale, something is structurally wrong.
For enterprise SaaS with long sales cycles and high ACV, the ratio tends to be higher because the upfront CAC is large and the payback period is longer. Investors in enterprise deals typically want to see 5x or more, because the risk of churn is higher — one lost enterprise customer can swing your numbers significantly.
For PLG and self-serve products, 3x is acceptable because the CAC is low and the volume is high. A $200 CAC with a $600 LTV is a 3x ratio that supports rapid scaling, even though the absolute dollar amounts are small.
What to Do If Your Ratio Is Low
If your LTV:CAC is below 3x, you have three levers.
Raise prices. This is the fastest fix and the one founders resist most. A 20% price increase flows directly to LTV without changing your CAC. If your ratio is 2.5x and you raise prices by 20%, it becomes 3x. Most founders are pricing 40 to 50 percent below what the market will bear, according to First Round Capital research.
Improve retention. Reducing churn from 5% monthly to 3% monthly increases LTV by 67%. This is harder than raising prices, but it compounds. Retention improvements made today continue paying dividends for the entire life of the customer.
Reduce CAC. This is the hardest lever because it usually means changing your channel strategy or improving your sales efficiency. But it's also the most rewarding — a 20% reduction in CAC improves the ratio by 25% without changing your product or pricing at all.
The best approach is all three at once: raise prices, fix the churn problem in onboarding, and optimize the sales process. A company that does all three can go from 2x to 5x in six months. I've seen it happen. It's not magic. It's just doing the work that most founders avoid because they'd rather build features than fix their unit economics.
Data references: KeyBanc Capital Markets 2022 SaaS Survey (median LTV:CAC 3.6:1, quartile ranges), Pacific Crest SaaS Survey (3.5:1 median), OpenView 2021 Benchmark Report (average 4:1, top quartile 7:1), SaaStr/First Round Capital (pricing benchmarks, ratio expectations by stage).
Ready to see how your unit economics stack up? Upload your deck or financials to Bullpen for a free AI-powered evaluation across 7 investor categories — including LTV:CAC, payback period, gross margin, and growth trajectory.
Get weekly pitch tips
One email a week. Actionable advice for founders.
Benchmark your metrics against investor expectations. Try now →