Lifetime Value: How to Calculate and Improve LTV
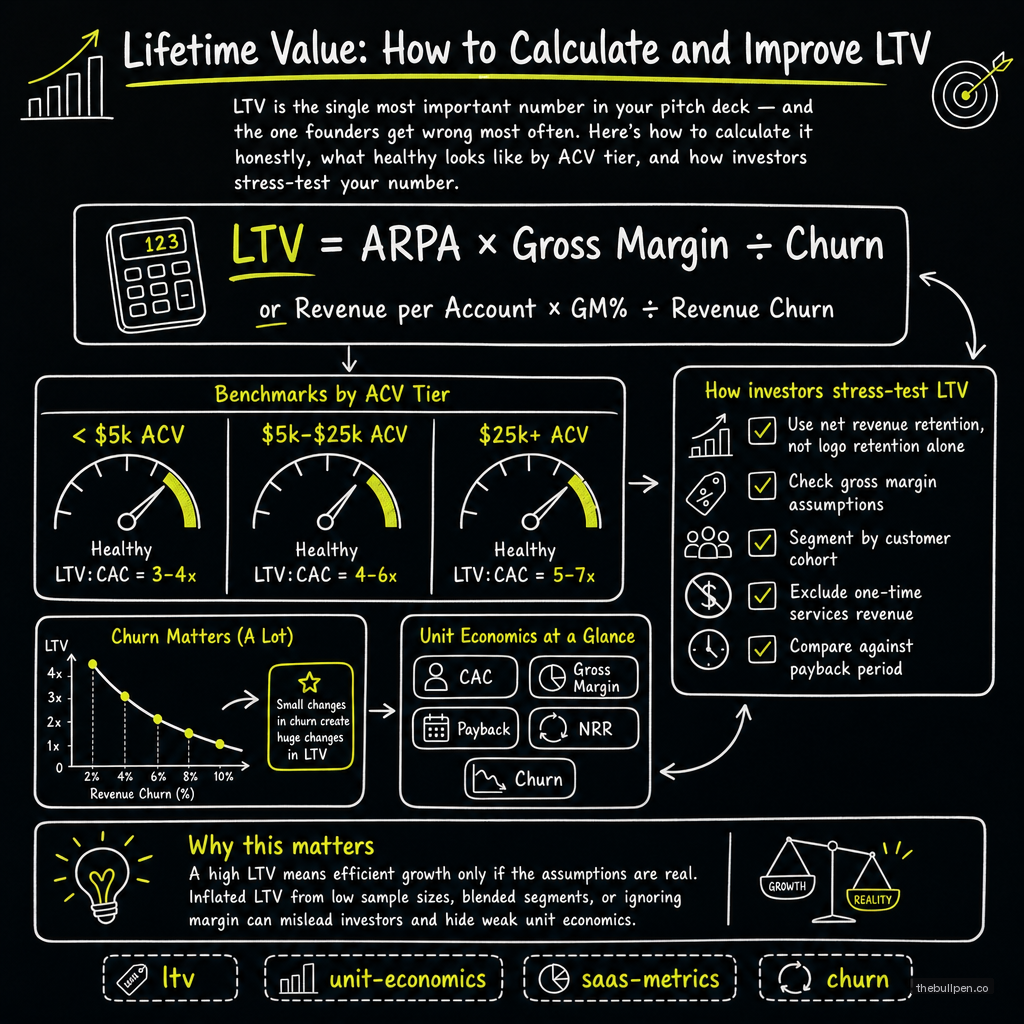
LTV is the single most important number in your pitch deck — and the one founders get wrong most often. Here's how to calculate it honestly, what healthy looks like by ACV tier, and how investors stress-test your number.
Every pitch deck I see has an LTV slide. Almost none of them are honest.
The number is always a round $10,000 or $25,000 or $100,000 — whatever looks impressive next to the CAC. The formula is always the same: ARPU times gross margin divided by churn. And the assumptions are always optimistic.
The problem isn't that founders inflate LTV intentionally. It's that LTV is one of those numbers where small input errors produce massive output errors. Use average churn instead of cohort churn and your LTV doubles. Forget to subtract COGS from ARPU and it jumps another 25%. Include one-time setup fees in "recurring" ARPU and you're in fantasyland before you even get to the division step.
I've seen a $5,000 LTV become a $50,000 LTV with three "minor" assumption changes that all seemed reasonable in isolation. The investor spotted it in about 12 seconds.
Related: Startup Metrics That Matter: What Investors Actually Look For
The Formula Is Simple. The Execution Is Not.
The textbook LTV formula couldn't be simpler:
LTV = Average Revenue Per User × Gross Margin ÷ Monthly Churn Rate
If your average customer pays $100 a month, your gross margin is 80%, and your monthly churn is 3%, your LTV is roughly $2,700. That number tells you how much gross profit you can expect to earn from a typical customer over their lifetime with you.
The problem is that every variable in that formula is a trap.
ARPU isn't just the average of what people pay. It's the average of what people pay recurringly — not setup fees, not implementation charges, not one-time professional services. Most founders include everything and call it ARPU. That's not ARPU. That's average revenue, and it overstates LTV by 20 to 40 percent depending on how services-heavy your business is.
Gross margin isn't 100% just because you're SaaS. It's typically 75 to 85 percent for healthy SaaS companies. If you're below 60%, you have a cost structure problem that LTV math can't fix — and if you're using 100% in your calculation, you're lying to yourself.
Churn is the most dangerous variable because it compounds. Use 5% monthly churn instead of the 2% you're modeling, and your LTV drops by 60%. That's the power of exponential decay.
The Mistake That Hurts Most: Average Churn
Nearly every founder calculates churn by taking their total lost customers over a period and dividing by total customers at the start. That's average churn. It's wrong, and it overstates LTV by 50 percent or more for early-stage companies.
Here's why: early-stage churn is almost always higher than mature customer churn. Customers who've been with you for 12 months churn at a much lower rate than customers who signed up last month. Average churn blends both groups together, hiding the fact that your newer cohorts are struggling.
The right approach is cohort-based churn analysis: group customers by the month they signed up, track how each cohort behaves over time, and calculate churn separately for each vintage. When you do this, you almost always find that your mature cohorts are fine and your recent cohorts are bleeding. That's actionable — you can fix the onboarding for the new cohorts. Average churn just tells you the blended number is bad without telling you why.
According to the Pacific Crest SaaS Survey (now KeyBanc Capital Markets), companies that switch from average churn to cohort churn typically see their calculated LTV drop by 30 to 50 percent. That's not a bad thing — that's knowing where you actually stand.
Related: The LTV:CAC Ratio: What's Healthy?
What Healthy Looks Like by ACV Tier
LTV means different things depending on who you're selling to.
Low-ticket SaaS — products under $50 a month — typically see LTV in the $500 to $3,000 range. A $30/month product with 70% gross margin and 3% monthly churn produces roughly $700 in lifetime value. The economics work because CAC is also low (often under $200 for PLG products). The LTV:CAC ratio is what matters, not the absolute LTV number.
Mid-market SaaS — $500 to $2,000 a month — usually shows LTV between $15,000 and $100,000. Churn is lower at this tier (1 to 1.5% monthly) and gross margins are higher (80%+). A $1,000/month customer with 80% margin and 1% monthly churn generates about $80,000 in LTV.
Enterprise SaaS — $10,000 a month and up — can produce LTV ranging from $150,000 to well over $1 million. Monthly churn at this tier is typically under 0.5%, and gross margins can hit 85% or more. But the CAC is also much higher — $50,000 to $100,000 is normal — so the ratio has to hold up.
The raw LTV number floats with your pricing. The metric that crosses tiers is the LTV:CAC ratio. KeyBanc's 2022 SaaS Survey found a median LTV:CAC of 3.6:1 across 200 companies, with the top quartile hitting 5:1 and above. If you're below 3:1, you have a unit economics problem regardless of how impressive your raw LTV looks.
How Investors Verify Your LTV
When an investor sees your LTV slide, they don't just trust the number. They verify it by asking four specific questions:
"Show me your churn by cohort for the last four quarters." If you can't produce this, they assume you haven't done cohort analysis and your LTV is overstated by 30 to 50 percent.
"What's your gross margin, specifically excluding services revenue?" If you can't separate product gross margin from services gross margin, they assume you're conflating them.
"Walk me through your ARPU calculation — is this recurring only, or does it include one-time charges?" If it includes one-time fees, they subtract them.
"What's your payback period?" This is the cross-check. If your payback period is 18 months and your claim LTV implies customers stay for 5 years, those two numbers need to be consistent. If they're not, something in your math is wrong.
The best way to pass this test is to lead with the honest number. A $5,000 LTV on a $1,500 CAC (3.3x) with cohort-validated churn data is more convincing than a $50,000 LTV on a $15,000 CAC (3.3x) with hand-wavy assumptions. Investors don't care about the absolute number. They care about the ratio and whether they can trust your inputs.
Data references: KeyBanc Capital Markets 2022 SaaS Survey (median LTV:CAC 3.6:1), Pacific Crest SaaS Survey (cohort vs average churn impact), OpenView 2021 Benchmark Report (LTV ranges by ACV tier), ProfitWell / SaaStr benchmarks (LTV:CAC by segment).
Ready to see how your unit economics stack up? Upload your deck or financials to Bullpen for a free AI-powered evaluation across 7 investor categories — including metric clarity, unit economics, and growth trajectory.
Get weekly pitch tips
One email a week. Actionable advice for founders.
Benchmark your metrics against investor expectations. Try now →