Net Revenue Retention: The Metric That Predicts Startup Success
Net Revenue Retention is the single best indicator of product-market fit and long-term unit economics. Here's what it means, what good looks like, and how to improve yours.
There's a metric that tells investors more about your business than MRR, growth rate, or gross margin. It predicts your future revenue with more accuracy than any other single number. It determines what valuation multiple you'll get. And most early-stage founders don't track it.
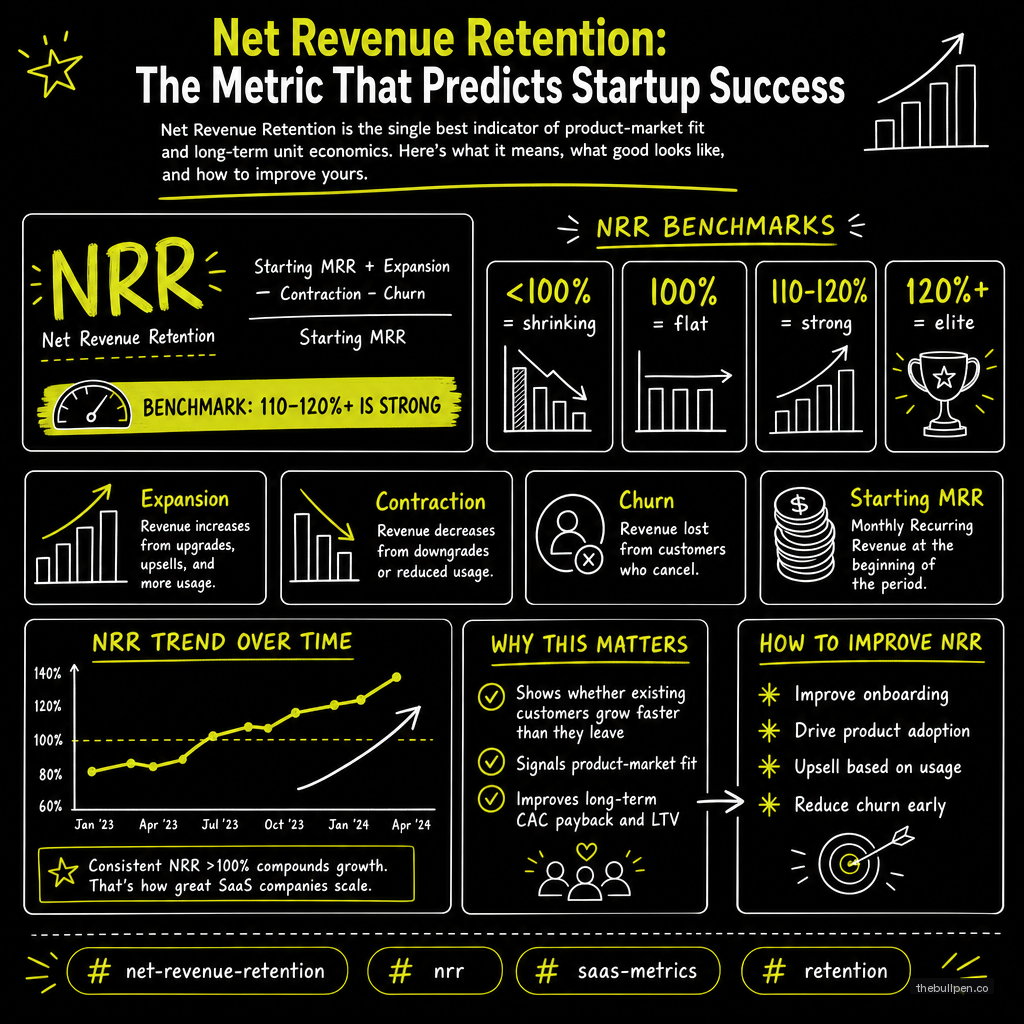
Net Revenue Retention measures how much revenue you keep and grow from your existing customer base, including expansions, upsells, and cross-sells, minus churn and contraction. The formula is simple:
NRR = (Beginning MRR + Expansion − Churn − Contraction) / Beginning MRR × 100
If you start the month with $100K MRR, add $20K in expansions, lose $5K to churn and $10K to downgrades, your NRR is 105%. That means your existing customers are growing you at 5% per month without a single new sale.
The implications are enormous. A company with $1M ARR and 130% NRR will grow to $1.3M ARR in one year from its existing customers alone. A company with $1M ARR and 90% NRR needs $200K in new business just to stay flat. Both companies look similar on a revenue chart. One is building an asset that compounds. The other is running on a treadmill.
Related: Startup Metrics That Matter: What Investors Actually Look For
What the Numbers Mean
NRR benchmarks are well established across public and private SaaS companies.
| NRR Range | What It Means | Examples |
|---|---|---|
| 130%+ | Best-in-class — revenue machine | Snowflake, Datadog (peak) |
| 110-130% | Strong — compounding growth | Zoom, Slack, Twilio (peak) |
| 100-110% | Healthy — slight net growth | HubSpot, most public SaaS |
| 90-100% | Warning — existing base shrinking | Needs immediate attention |
| Below 90% | Critical — structural churn problem | Product or go-to-market issue |
The best-in-class companies — Snowflake at 130-168%, Datadog consistently above 130%, Zoom at 130% during its peak — share a common trait: their revenue grows as their customers grow. Usage-based or consumption-based pricing means that when a customer succeeds, the startup succeeds more. Land one enterprise account, and if they double their usage every year, your revenue doubles with zero extra sales cost.
This is why NRR matters more than new MRR at scale. New MRR is linear — you earn it once and start over next month. NRR above 100% compounds. A company with 130% NRR and no new sales will grow 30% per year from its existing base. A company with 100% NRR and strong new sales must keep feeding the top of the funnel just to stay in place.
Related: MRR and ARR: The Truth About Recurring Revenue
The Investor Obsession
Venture investors spend more time on NRR than any other metric during Series A diligence. The reason is straightforward: NRR is the clearest signal of product-market fit.
If your existing customers are spending more with you over time, two things must be true. First, your product is delivering increasing value. Second, your pricing captures that value proportionally. Both are hard to fake and hard to copy.
Jason Lemkin of SaaStr has been saying this for a decade: NRR is the single best indicator of whether a SaaS company will generate venture-scale returns. SaaS companies with NRR above 120% typically command 2-3x higher revenue multiples than those with NRR below 100%. An extra 10 percentage points of NRR can add hundreds of millions to a Series B valuation.
The obsession makes sense from a portfolio perspective. A VC fund needs a small number of companies to return the entire fund. Companies with high NRR are the ones most likely to do that because their revenue compounds without requiring proportional increases in sales spend. They're more capital efficient, which means less dilution and higher eventual ownership for early investors.
How to Improve NRR
If you run a SaaS company and your NRR is below 110%, there are four levers to pull.
Product-led expansion. The most efficient way to increase NRR is to let successful customers naturally spend more. Usage-based pricing achieves this automatically — as customers use more, they pay more. Slack expanded from teams to entire organizations without a sales call. Snowflake's consumption model means every new query generates incremental revenue. If your pricing doesn't have a natural expansion path, your NRR ceiling is limited by how often you can schedule a pricing conversation.
Land-and-expand sales motion. Start with a small, low-risk entry point, then expand into the organization over time. Zoom sold to individual teams, then departments, then the whole company. Atlassian starts with a single team using Jira or Confluence and expands to hundreds of seats. Every successful land is the start of a relationship, not the end of a sale.
Customer success that drives outcomes, not just retention. Most CS teams are measured on churn prevention. The best CS teams are measured on expansion. They identify power users, help them champion larger deployments, and proactively suggest use cases that increase value. A CS team that drives expansion can add 10-20 points to NRR.
Pricing and packaging that rewards growth. Annual contracts with built-in escalators, tiered plans with clear upgrade paths, and bundling that makes it easier to buy more than one product all push NRR higher. The best pricing strategy for NRR is one where the customer's success is mechanically linked to your revenue. If they win, you win.
Related: LTV:CAC Ratio: The Metric Investors Check First
Common Mistakes
Confusing gross retention with net retention. Gross retention measures revenue you kept without any expansion — it can never exceed 100%. Net retention includes expansion. Reporting gross retention as your only retention metric hides whether your existing customers are growing or shrinking.
Ignoring contraction. Contraction — customers downgrading, reducing seats, or lowering usage — eats expansion silently. A company can have strong upsells while losing just as much to silent downgrades. Track contraction separately and understand why it happens.
Looking at blended NRR without cohort analysis. A 110% blended NRR can hide a terrible story: large enterprise accounts expanding at 150% while SMB customers churn at 80%. Segment NRR by customer size, acquisition channel, and product line. The segments tell different stories.
Defining expansion too broadly. Including one-time setup fees or professional services in expansion inflates NRR artificially. True expansion is recurring revenue from the existing customer base — upgrades, seat additions, and cross-sells of other products.
The best time to start tracking NRR is before you need to report it to investors. Build the calculation into your monthly reporting from day one. The data history you accumulate is itself an asset — a 24-month NRR trend tells investors more about your business than any single month's MRR number.
Published on the Bullpen Blog. New articles every day at 9 AM UTC.
Get weekly pitch tips
One email a week. Actionable advice for founders.
Benchmark your metrics against investor expectations. Try now →