MRR and ARR: The Truth About Recurring Revenue
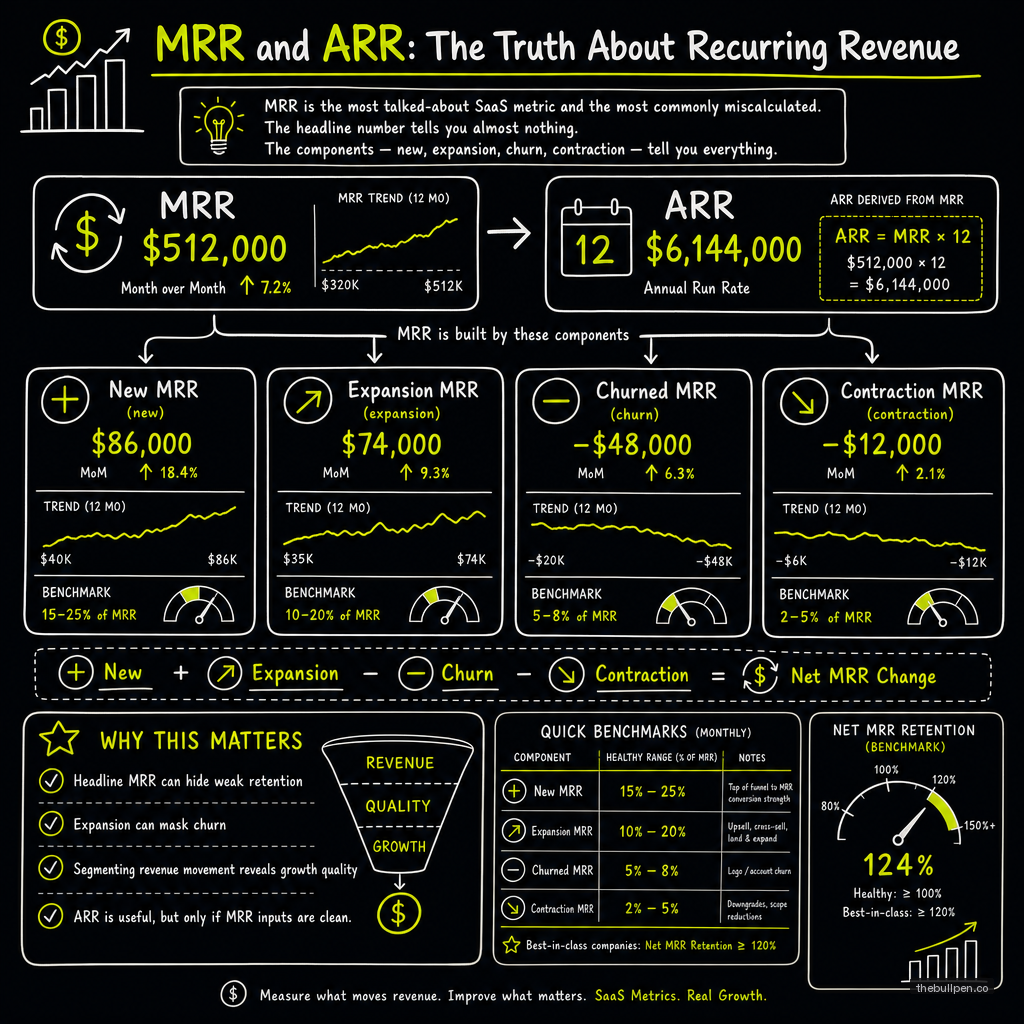
MRR is the most talked-about SaaS metric and the most commonly miscalculated. The headline number tells you almost nothing. The components — new, expansion, churn, contraction — tell you everything.
Every SaaS founder knows what MRR stands for. Very few know how to calculate it correctly. Even fewer know how investors actually read it.
That gap is expensive. I've seen founders pitch $50K MRR to investors who, after five minutes of questions, revealed it was actually $35K in real net recurring revenue after stripping out annual prepaids, professional services, and churn that hadn't been booked yet. The founder walked in thinking they had a Series A story and walked out with a "come back when you have clean numbers."
ARR has the same problem, amplified. A founder with $8K MRR will say they have "$96K ARR" as if annualizing a number that's barely three months old makes it more real. It doesn't. ARR is a stability metric. It becomes meaningful when your revenue is stable — typically above $1M ARR. Before that, it's just MRR times twelve with extra parentheses.
Related: Startup Metrics That Matter: What Investors Actually Look For
What MRR Actually Measures
MRR is the sum of all recurring subscription revenue you collected in a month, normalized to exclude one-time charges, variable fees, and non-recurring add-ons. It's a forward-looking run rate, not a cash metric.
| What Counts as MRR | What Does Not |
|---|---|
| Monthly subscription fees | One-time setup fees |
| Annual contracts recognized monthly | Professional services |
| Committed usage minimums | Variable overage charges |
| Recurring add-ons | Hardware sales |
| Seat-based pricing (contracted seats) | Implementation consulting |
The most common mistake founders make is including one-time revenue in MRR. A $10,000 implementation fee collected in January is not MRR. Putting it in inflates January and leaves February looking like a down month. Strip it out and your MRR tells a clean story about your recurring base.
The Five Components
A single MRR number is nearly useless. Investors decompose it into five parts, and the ratio between them tells a more complete story than any headline figure.
| Component | Definition | What It Signals |
|---|---|---|
| New MRR | Revenue from new customers acquired this month | Top-of-funnel health, GTM efficiency |
| Expansion MRR | Revenue increases from existing customers (upsells, cross-sells, price increases) | Product stickiness, land-and-expand motion |
| Contraction MRR | Revenue lost from downgrades (lower plans, fewer seats) | Customer satisfaction, usage trends |
| Churned MRR | Revenue lost from customers who cancel entirely | Product-market fit, customer success quality |
| Reactivation MRR | Revenue from previously churned customers who return | Sales efficiency, brand retention |
| Net New MRR | New + Expansion + Reactivation − Contraction − Churn | Real growth after attrition |
Net New MRR is the single most important number in a SaaS business. It captures everything: whether you're acquiring customers, whether you're keeping them, whether you're growing them, and whether any of that is being offset by cancellations or downtrading.
A Ratio of New + Expansion to Contraction + Churn above 2:1 is strong. That means for every dollar you lose, you're adding two or more. Below 1:1 means you're operating a leaky bucket — adding customers but losing revenue faster than you're gaining it. That company will eventually collapse under its own churn rate.
Related: A Complete Guide to Customer Acquisition Cost (CAC)
How Investors Read Your MRR
Investors look at MRR through five lenses. The headline number is the last thing they check.
Growth rate. Month-over-month MRR growth is the strongest predictor of long-term venture outcome. The benchmarks are well established:
| Stage | MoM Growth Target | Annualized |
|---|---|---|
| Pre-seed (0-$1K MRR) | 20%+ | ~890% YoY |
| Seed ($1K-$10K MRR) | 15-20% | ~435-890% YoY |
| Early Series A ($10K-$100K MRR) | 10-15% | ~214-435% YoY |
| Scaling ($100K+ MRR) | 5-10% | ~80-214% YoY |
Below 5% MoM growth at any stage means you're a lifestyle business, not a venture-backable company. The math is unforgiving: a company growing 5% MoM takes 14 months to double. At 20%, it takes 4 months. In a 10-year fund lifecycle, the 20% company creates venture returns and the 5% company doesn't.
Net Revenue Retention. NRR measures how much revenue you keep and grow from your existing customer base. The formula:
NRR = (Beginning MRR + Expansion − Churn − Contraction) / Beginning MRR
A company with 120% NRR grows 20% per year from its existing customers alone, without acquiring a single new one. That compounds dramatically over time. The best companies — Snowflake, Zoom, Slack at their peaks — had NRR above 130%. The average public SaaS company runs around 110-120%. Below 100% means your existing customers are shrinking, and you're running faster to stay in place.
Gross MRR churn. Monthly revenue lost to cancellations. For SMB-focused SaaS, 3-5% monthly churn is common but terrible on an annualized basis (36-60% annual churn). For enterprise SaaS, monthly churn should be below 1%. Anything above 2% monthly in enterprise and the math doesn't work long-term.
Payback period. How many months of gross margin it takes to recover your customer acquisition cost:
Payback = CAC / (MRR per customer × Gross Margin %)
Under 12 months is good. Under 6 months is exceptional. Above 18 months means you're spending too much to acquire customers who pay too little — a classic zombie SaaS pattern.
ARR valuation multiples. Once you're above $1M ARR, valuation conversations shift to multiples. The rough heuristic is 10-30x ARR at Series A, heavily modulated by growth rate. A company growing 100% YoY might get 20x ARR; one growing 50% might get 10x.
| ARR | YoY Growth | Rough Series A Multiple | Implied Valuation |
|---|---|---|---|
| $1M | 100% | 20x | $20M |
| $1.5M | 80% | 15x | $22.5M |
| $2M | 50% | 10x | $20M |
| $3M | 30% | 6x | $18M |
Growth rate drives multiples more than raw ARR at early stage. A $1M ARR company growing 100% often out-prices a $3M ARR company growing 30%.
Related: LTV Calculation for SaaS Startups
Common Inflation Tactics (and Why They Backfire)
Founders inflate MRR in predictable ways. Investors have seen all of them.
Annual prepaid counted as monthly. You book a $12K annual contract and report $1K MRR for 12 months. This is technically correct — you have $1K MRR from that customer. But if you're doing this across many customers and counting the full annual payment as cash in one month while spreading the MRR across 12, your cash and MRR trajectories will diverge. Investors will ask why.
Multi-year contracts annualized. A 3-year, $36K deal becomes $12K ARR. The ARR is meaningful if the customer is sticky, but investors will discount multi-year contracts relative to annual renewals because the churn signal is delayed.
Professional services included in MRR. This is the clearest red flag. Implementation fees, training, consulting — none of it is recurring. Including it inflates your MRR and makes your true subscription revenue look stronger than it is. Strip it out.
Ramp contracts reported at full value. A contract that starts at $200/month and ramps to $500/month in month 6 should not be reported as $500 MRR on day one. The initial value is $200. The ramp is future expansion MRR.
The reason these tactics backfire isn't that investors won't figure them out — they will, within the first five minutes of looking at your data. The reason is that they erode trust. If you're inflating MRR, what else are you inflating? And if your numbers were strong enough to stand on their own, you wouldn't need to inflate them.
The Right Way to Report MRR
The cleanest MRR report an early-stage founder can present looks like this:
Beginning MRR:            $42,000
+ New MRR:                +$8,000
+ Expansion MRR:          +$3,200
− Contraction MRR:        -$1,100
− Churned MRR:            -$1,800
= Net New MRR:            +$8,300
= Ending MRR:             $50,300

MoM Growth Rate:          19.8%
Net Revenue Retention:    112%
Gross MRR Churn:          4.3%
Five numbers, two derived ratios. That's all an investor needs to see to understand the health of your business. Everything else — NPS scores, engagement metrics, customer interview quotes — is supporting detail.
The best time to start tracking this level of detail is before you need it. Most founders start building clean MRR reports when they start fundraising. By then, the historical data is already messy. Start on day one, or at least start cleaning the data now.
Published on the Bullpen Blog. New articles every day at 9 AM UTC.
Get weekly pitch tips
One email a week. Actionable advice for founders.
Benchmark your metrics against investor expectations. Try now →