Growth Accounting: Where Your Growth Comes From
Decomposing growth into new vs expansion vs churned revenue.
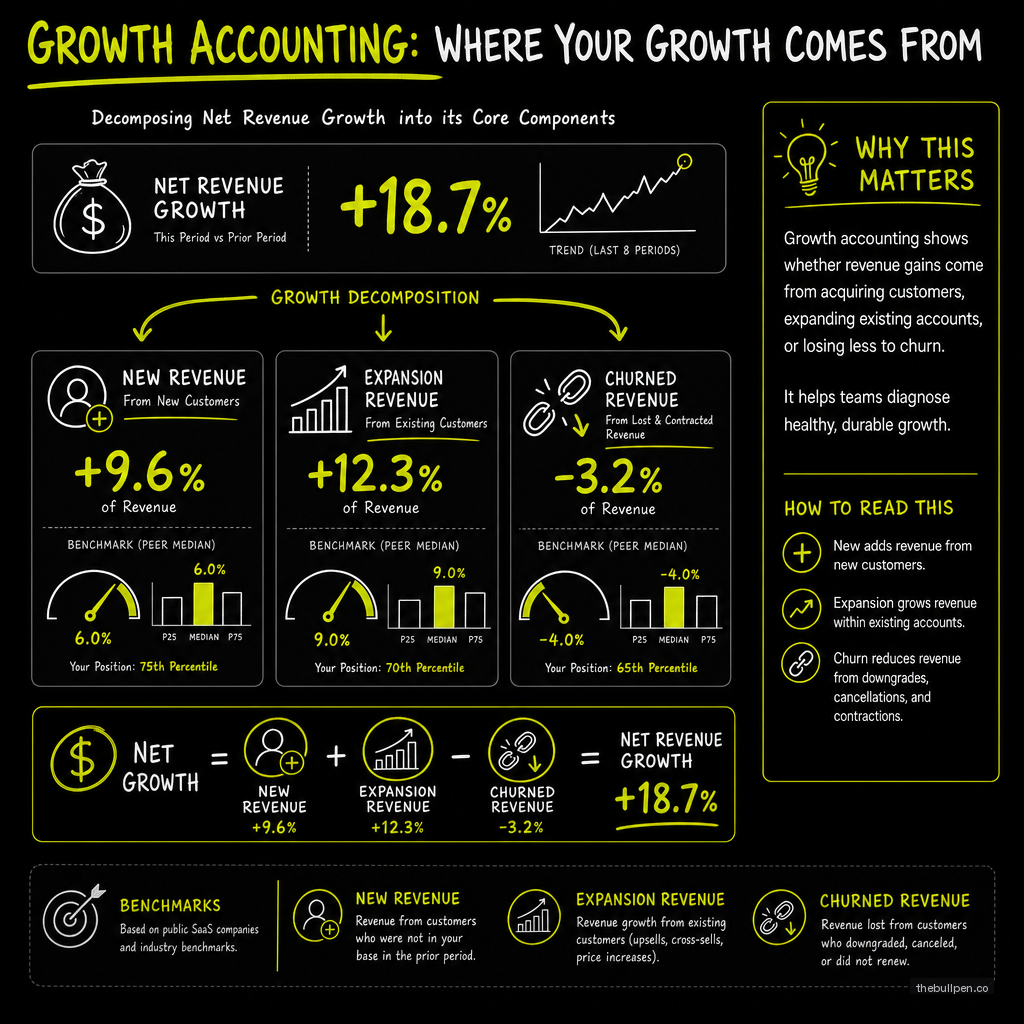
Your top-line revenue is growing. Congrats. Now for the uncomfortable question: where is that growth coming from, and is any of it real?
Most founders can rattle off their MRR, their growth rate, and maybe their churn. Ask them to decompose their growth and the story gets fuzzy fast. "We, uh, got some new customers. Some existing ones upgraded. I think a couple churned." That answer doesn't survive a Series A data room.
Growth accounting fixes this. It takes a single number — net new revenue — and splits it into three pieces that tell a completely different story about your business. The formula is stupidly simple:
Net New Revenue = New Revenue + Expansion Revenue − Churned Revenue
New Revenue is what you earned from customers who paid you for the first time this month. Expansion Revenue is what existing customers paid you above what they paid last month — upgrades, seat additions, cross-sells, price increases. Churned Revenue is what you lost from customers who canceled or downgraded.
Three numbers. They tell you whether you're building a compounding asset or running a hamster wheel.
Related: Startup Metrics That Matter: What Investors Actually Look For
The Decomposition That Exposes Everything
Here's why growth accounting matters more than the headline growth number. Two companies, same growth rate, completely different trajectories.
| Company A | Company B | |
|---|---|---|
| Starting ARR | $5M | $5M |
| New Revenue (month) | $400K | $200K |
| Expansion Revenue | $50K | $250K |
| Churned Revenue | ($50K) | ($150K) |
| Net New Revenue | $400K | $300K |
| NRR | 99% | 120% |
| Growth Quality | Low | High |
Company A looks better on net new revenue — $400K vs $300K. But Company B's growth has a fundamentally different quality. Its existing customers are expanding faster than they're churning. Every dollar of sales spend goes further because the base compounds. Company A is outrunning its leaky bucket with brute-force acquisition spend. If Company A's sales team takes a month off, growth flatlines. If Company B takes a month off, their existing customers still push revenue up by $100K.
David Sacks, who formalized growth accounting at Craft Ventures in 2015, has a blunt framework for this: the quality ratio, defined as Expansion Revenue divided by Churned Revenue. Sacks says:
"Growth without retention is fake growth."
His thresholds are simple. A quality ratio above 1x means expansion covers churn , your existing base is net growing. Above 2x is great. Above 3x is exceptional. Most early-stage companies live below 1x, which means every dollar of growth is borrowed against future churn.
| Quality Ratio | What It Means |
|---|---|
| < 1x | Expansion doesn't cover churn. Existing base is shrinking. |
| 1x - 2x | Net neutral to modest expansion. Need heavy new sales. |
| 2x - 3x | Strong expansion engine. Growth compound starts. |
| 3x+ | Exceptional. Revenue flywheel is self-sustaining. |
If your quality ratio is below 1x, your growth is fragile. The foundation erodes while you're busy painting the walls.
Related: Net Revenue Retention: The Metric That Predicts Startup Success
What Good Looks Like by Stage
The balance between new and expansion revenue shifts dramatically as a company matures. Early-stage companies are (correctly) all-in on new customer acquisition. You don't have a base to expand into. But the goal is to shift that balance over time until your existing customers become your primary growth engine.
| Stage | ARR Range | New Revenue % | Expansion % | Monthly Churn |
|---|---|---|---|---|
| Early | < $5M | 70-80% | 10-20% | 3-7% |
| Growth | $5M - $50M | 50-60% | 30-40% | 1-2% |
| Scale | $50M+ | 30-40% | 50-60% | < 1% |
These ratios are a roadmap. If you're at $10M ARR and still getting 80% of growth from new customers, your expansion engine isn't firing. That's a pricing problem, a product problem, or a customer success problem. Probably all three.
The companies that have figured this out trade at multiples that seem insane until you understand the math.
- Atlassian generates 80% of its ARR from existing customers. Two decades of land-and-expand with zero sales team. Their quarterly earnings calls are boring because the model works without drama.
- Snowflake has sustained NRR above 140%. More than 80% of their growth comes from existing customers consuming more data, running more queries, storing more bytes. Their customer acquisition cost effectively amortizes to zero because every customer grows without incremental sales spend.
- HubSpot reported that 65% of Q3 2024 revenue growth came from existing customers. They've built a cross-sell machine that converts CRM customers into Marketing Hub customers into Sales Hub customers into Service Hub customers. Each product is an expansion trigger.
- Zoom ran at 130%+ NRR before the post-pandemic slowdown. Every organization that adopted Zoom expanded seat count naturally as more teams wanted in.
The Bessemer Cloud Index makes the valuation consequence explicit. Companies with NRR above 130% consistently trade at 10x+ ARR multiples. Companies with average NRR trade at roughly 5x. That's not a minor difference . 130% NRR doubles your valuation multiple.
Related: MRR and ARR: The Truth About Recurring Revenue
What VCs Actually See When They Read Your Numbers
When a VC looks at your growth accounting spreadsheet, they're not just checking totals. They're asking four specific questions.
First: How capital efficient is your growth? If most of your growth comes from new customers, they want to know how much equity you burned to get them. Divide your net new ARR by total capital raised. If that number is below $0.50 of ARR per dollar raised, you have an efficiency problem , unless your NRR is above 120%, in which case you get a pass because the compounding will eventually make the math work.
Second: What's your organic vs paid acquisition mix? Growth from paid channels that stops when you stop spending is not the same as growth from word-of-mouth, product-led virality, or content. Decompose your new revenue by channel. If 70%+ comes from paid, a market downturn kills your growth. VCs with bad memories from 2022-2023 are particularly sensitive to this.
Third: Is your NRR real? KeyBanc's 2024 private SaaS survey found median NRR of 108% for private companies and 115% for public companies. OpenView's benchmarks put top-quartile NRR at 125%+. If you're claiming NRR above 130%, a VC will want to see it segmented by cohort , because a blended 130% can hide early customers at 80% NRR offset by a few large accounts at 200%. The SKU-level breakdown tells the real story.
Fourth: Are you growing the right way for your stage? A $3M ARR company with 70% of growth from expansion looks impressive until you realize they're not attracting new customers at a rate that suggests product-market fit. Early-stage businesses that over-index on expansion before establishing market presence can fool themselves into thinking they've found PMF when they've really just found a small group of tolerant buyers.
How to Build Your Growth Accounting System
If you're not doing growth accounting yet, start today. You don't need a BI tool or a data team.
Pull your MRR report each month and categorize every dollar of change into one of three buckets: New (first-time customers), Expansion (existing customers paying more), Churned (customers who left or downgraded). If a customer went from $1,000/month to $1,500/month, that's $500 in expansion. If they went from $1,000 to $0, that's $1,000 in churn. If they went from $1,000 to $500, that's $500 in churn (contraction counts as churn in the growth accounting framework).
Track this monthly. Plot the trend over 12 months. You're looking for three signals:
- Is the expansion line trending up as a percentage of total growth? It should, or you're not building a compounding asset.
- Is the churn line flat or declining in absolute dollars? If churn grows proportionally with revenue, your retention isn't improving , your base is just bigger.
- Is the quality ratio (Expansion / Churned) crossing the 1x threshold? If not, you haven't built a self-sustaining base yet. That's fine at $2M ARR. It's a problem at $20M ARR.
Most founders think they're building a rocket ship. Growth accounting tells you whether you're building one or just stacking boosters on a leaky balloon. The good news is you can fix the holes. But you have to know where the holes are first.
Published on the Bullpen Blog. New articles every day at 9 AM UTC.
Get weekly pitch tips
One email a week. Actionable advice for founders.
Benchmark your metrics against investor expectations. Try now →