Traction Slide Examples: What Seed-Stage Investors Actually Want to See
The traction slide gets the most investor attention of any slide in your deck — 2.5 minutes on average, per DocSend. Here's what seed-stage investors are actually looking for, with real examples from funded decks.
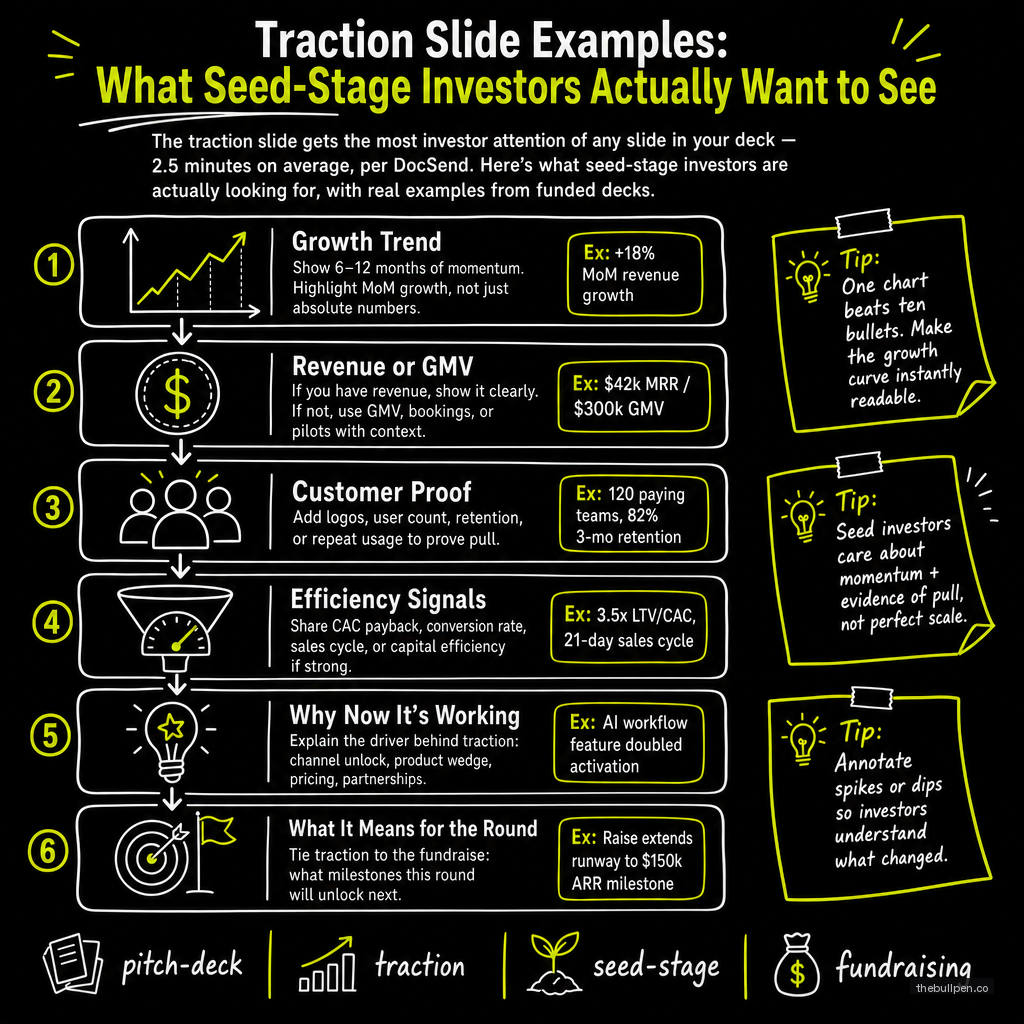
The traction slide is the most scrutinized part of your pitch deck. DocSend's eye-tracking study of 200+ venture investors found they spend nearly 2.5 minutes on the traction slide — longer than any other slide, including financials. When investors say they skip the team slide in 30 seconds but camp out on traction, that's where your company lives or dies.
But most traction slide advice assumes you have meaningful revenue. At seed stage, most founders don't. You're raising before product-market fit, before $10K MRR, often before launch. A generic "show your hockey-stick growth chart" recommendation is useless when your chart has three data points and the slope is barely positive.
What counts as traction at your stage depends entirely on where you are in your journey. The most successful seed decks understood this intuitively.
Related: The Complete Guide to Building a Pitch Deck
The Investor's Mental Model for Traction
Investors read traction slides looking for one thing: evidence that demand exists and is accelerating. They're not looking for a billion-dollar valuation signal. They're looking for a pattern they can extrapolate.
The variables they're evaluating are the same regardless of your stage:
| Signal | What It Proves | Strong Example |
|---|---|---|
| Growth rate | Demand is accelerating | Buffer: 11% WoW growth on $5K MRR |
| Retention | Product is sticky | Front: 95% monthly retention |
| Revenue trajectory | Business model works | Airbnb: $2.5K/week revenue, up from zero |
| Engagement | Users actually use it | Uber: 70% satisfaction, 8-min avg wait |
| Customer names | Real people pay | Front: Box, Stripe, Shopify as customers |
Notice that none of these require huge numbers. Buffer's seed deck showed $5K MRR with 11% weekly growth. That's not a lot of revenue — but the growth rate told the story. Airbnb showed $2,500 per week in revenue during YC demo day, which is barely a living wage. But the trajectory from zero to recurring bookings was visible and clearly accelerating.
Related: How to Nail the Problem Slide
Real Traction Slides from Funded Decks
The best way to understand what works is to look at what actually raised money.
Buffer (Seed, 2011). Slide 5, titled "Traction." The headline number: $5,000 MRR in 3 months. Below it: a line chart showing MRR growth from zero to $5K over six months, paired with the phrase "Growing 11% week-over-week." Right below that: "92% monthly retention." Three numbers, one chart, one story — we're growing fast and people stick.
Airbnb (YC Demo Day, 2009). No explicit "Traction" slide. Instead, they embedded their traction into the Business Model slide. A bar chart showed weekly bookings growing from zero to 800+. Below it: "10,000+ nights booked" and "18% of users have booked again." The retention number was the real signal — not total bookings, but the fact that users came back.
Front (Seed, 2014). A clean MRR growth curve over 12 months showing exponential trajectory. Headline: "$30K MRR (9 months post-launch)." Secondary: "200+ companies including Box, Stripe, Shopify" with their logos. Customer logos served as both traction proof and social proof simultaneously.
Uber (Series A, 2011). "Early Traction & User Stats" — 5,000+ rides completed, $1,000+ revenue per day, doubling every month. They showed operational metrics (8-minute average wait time, 70% satisfaction rate) because their product was marketplace liquidity, not SaaS metrics.
| Deck | Year | Headline Metric | Growth Signal | Retention Signal |
|---|---|---|---|---|
| Buffer | 2011 | $5K MRR | 11% WoW | 92% monthly retention |
| Airbnb | 2009 | 10K nights booked | Bar chart: 0→800/week | 18% rebook rate |
| Front | 2014 | $30K MRR | Exponential curve | 95% monthly |
| Uber | 2011 | 5K rides completed | Doubling monthly | 70% satisfaction |
| Mint.com | 2007 | 1M+ users | 200% MoM growth | — |
The pattern across all five: one headline number that establishes scale, a growth rate that shows acceleration, and a retention or quality metric that proves the growth isn't fake.
How to Build Your Traction Slide at Seed Stage
Your traction slide structure depends on what you have. Three scenarios cover most seed-stage companies.
Scenario 1: You Have Revenue ($1K-$10K MRR)
Lead with the number and the growth rate. Format: "$X MRR · Growing Y% MoM." Below it, a simple line chart — monthly revenue for the last 6-12 months. Log scale if the growth is exponential (it probably isn't yet at $5K MRR, so linear is fine). Include a retention metric to the side: monthly retention, cohort retention, or NRR.
What matters most is the trajectory. Jason Lemkin of SaaStr has said publicly that $2K MRR with 100% MoM growth is a stronger signal than $50K MRR with 5% growth. Early stage is about velocity, not absolute scale.
Scenario 2: You Have Users But No Revenue
If you're pre-revenue but have a waitlist, beta users, or engagement metrics, lead with those. A waitlist of 10,000 signups in 3 weeks backed by an 18% conversion rate to paid is a valid traction story. Show the waitlist growth as a daily or weekly chart.
Product Hunt launch results. GitHub stars. DAU/MAU ratios. NPS scores. Letters of intent from potential customers. All of these are traction signals, and all of them have appeared in funded seed decks.
The key is showing acceleration in any signal you present, along with the volume. "10,000 total users" is weak. "10,000 users in 3 weeks, growing 30% week-over-week" is strong.
Scenario 3: You Have Nothing (Pre-Launch)
This is the hardest scenario, and it's where most founders reading this are. If you have zero users, zero revenue, and zero waitlist, your traction slide needs to show something else: evidence that your understanding of the problem is so deep that the market will respond.
Pilot agreements with named companies. Letters of intent with expected revenue. Advisor commitments from industry experts. Customer development interviews that revealed a painful, urgent problem. Anything that shows you've done the work and the market has validated your thesis.
YC's advice on this is blunt: if you have no traction of any kind, don't try to fake it or hide it. Instead, focus the entire deck on why you're the right person to solve a massive problem and why now is the moment. Some of the best companies raised their first money with no traction at all — they just told a compelling enough story about why it was inevitable.
Related: Market Sizing: How to Present TAM, SAM, and SOM
What Not to Do
The common mistakes on traction slides are well documented and consistently fatal.
| Mistake | Why It's Fatal | What to Do Instead |
|---|---|---|
| Showing total users without growth | Absolute numbers are static; investors need rate of change | Put growth rate next to every absolute number |
| Decimal points on small numbers | $1,234.56 looks insignificant; $1.2K looks intentional | Round to nearest meaningful increment |
| Inconsistent time scales | Switching from weekly to monthly looks like manipulation | Use consistent time intervals |
| Hiding churn or retention | Every investor asks about retention — being unprepared is worse than showing bad numbers | Show retention even if imperfect |
| Drowning in metrics | One clear story beats a dashboard of noise | Pick 3 metrics max |
| Faking it | Investors will call your top customers | Never lie — the truth will surface |
The last one is the most important. Investors at seed stage have a high tolerance for small numbers. They have zero tolerance for dishonesty. If your traction slide says "10,000 users" but those users are your mom and her book club, the trust you lose will follow you beyond this round.
The One-Slide Template
If you need a starting point, this structure has raised money across hundreds of seed rounds:
Traction

[$X MRR] · Growing [Y%] Month Over Month

[Line chart: Revenue or Users, last 6-12 months]

[Retention: Z% monthly / NRR]

3 customer logos (name companies, not just logos)
Three numbers. One chart. Three names. That's all the traction slide needs to do.
Published on the Bullpen Blog. New articles every day at 9 AM UTC.
Get weekly pitch tips
One email a week. Actionable advice for founders.
Upload your deck. Get scored in 2 minutes. Free. Try now →