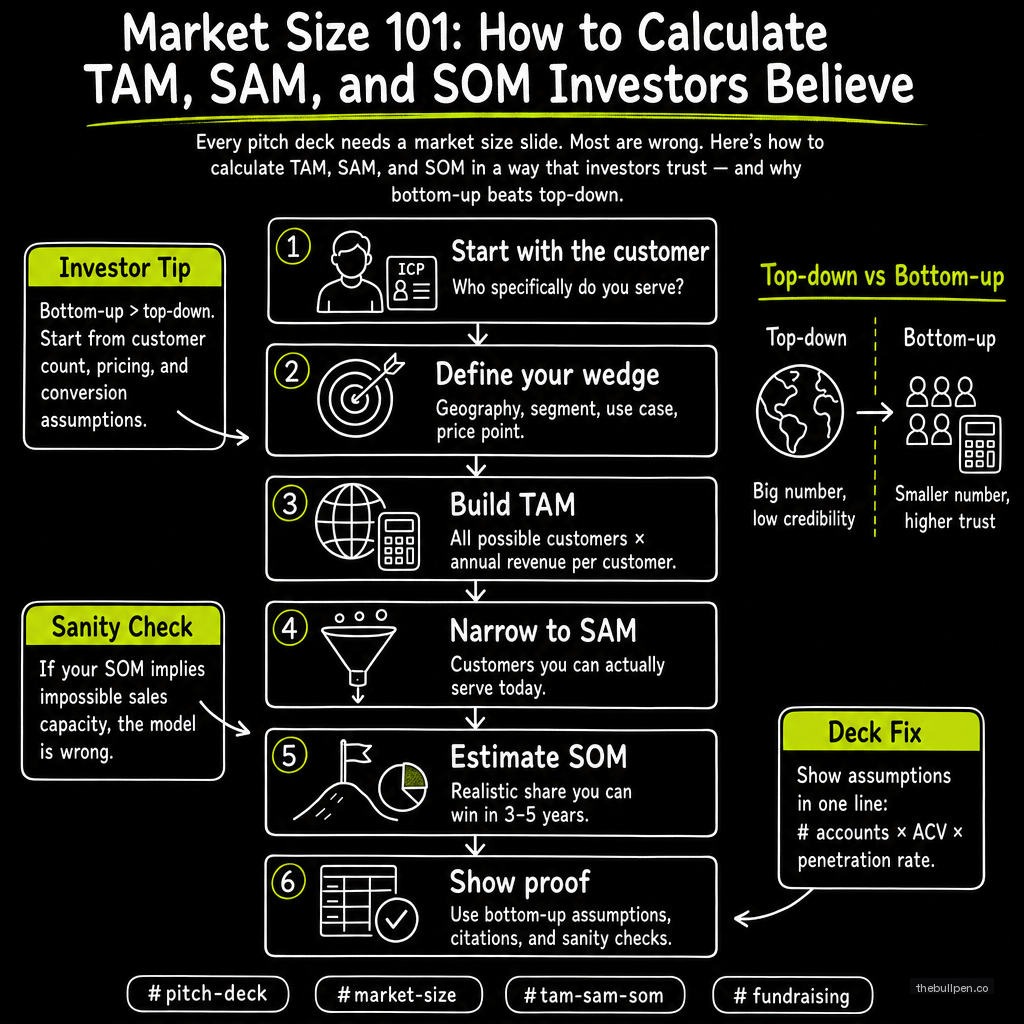
Market Size 101: How to Calculate TAM, SAM, and SOM Investors Believe
Every pitch deck needs a market size slide. Most are wrong. Here's how to calculate TAM, SAM, and SOM in a way that investors trust — and why bottom-up beats top-down.
Every pitch deck has a market size slide. Most of them are useless.
The founder throws up a TAM of $50 billion, cites a Gartner report from 2021, and expects the investor to nod approvingly. Instead, the investor thinks: "You just Googled a number and put it on a slide. That tells me nothing about whether you understand your market."
The purpose of the market size slide is not to impress the investor with how big the opportunity is. It's to demonstrate that you understand the mechanics of your market — who your customers are, how many of them exist, how much they spend, and why you can capture a meaningful share.
An honest market size slide is more convincing than an impressive one.
Related: The Complete Guide to Building a Pitch Deck That Raises Capital
The Three Numbers
| Term | Definition | Example |
|---|---|---|
| TAM (Total Addressable Market) | The total revenue opportunity if every possible customer bought your product | All companies worldwide that use CRM software |
| SAM (Serviceable Addressable Market) | The segment of TAM that your product can reach given your distribution model | Mid-market tech companies in North America that use CRM |
| SOM (Serviceable Obtainable Market) | The portion of SAM you can realistically capture in the near term | 500 mid-market tech companies you can sell to in year one |
TAM answers "how big could this be?" SAM answers "who can you actually sell to?" SOM answers "how much will you sell this year?"
Investors care most about SAM and SOM. TAM is a curiosity. SAM tells them if you understand your distribution. SOM tells them if your go-to-market plan is realistic.
Bottom-Up vs Top-Down
Top-down market sizing starts with a large number and carves out a percentage. "The global CRM market is $80 billion. We'll capture 1% of that." The problem is that 1% of an $80 billion market is $800 million — a number that sounds plausible but has no basis in reality. Why 1%? Why not 0.5% or 2%? The number is made up, and the investor knows it.
Bottom-up market sizing starts with a single customer and builds up. "There are 10,000 mid-market tech companies in North America. Each spends $50,000/year on CRM tools. That's $500 million in SAM. We can reach 2,000 of them through our channel partnerships. At 10% penetration in year three, that's $10 million in revenue."
The bottom-up number is defensible. The investor can challenge the assumptions — "how many companies, really?" — but they can't dismiss the logic. Bottom-up shows you've done the work.
The rule: if you can't explain how you got to your TAM by counting actual customers and multiplying by actual revenue, you haven't done the work.
The Mistakes That Kill Market Size Slides
Citing a $100B market. Investors have seen too many founders claim a $100B TAM from a Statista link. Unless you're building in a genuinely massive market, a $500M SAM is more credible than a $100B TAM.
Using only top-down numbers. A top-down TAM is fine as a headline. But if your entire market size slide is one line from a Gartner report, you look like you spent 5 minutes on it. Show the bottom-up math.
Inflating SOM. Founders who claim they'll capture 20% of their SAM in year one signal inexperience. A realistic SOM for a first-year startup is 0.1% to 1% of SAM, depending on the market. Anything above 5% needs extraordinary justification.
Mixing sources. Don't use a Gartner number for TAM, a Forrester number for SAM, and your own estimate for SOM. Use one consistent methodology across all three tiers, or explain why you're mixing sources.
The Template
A great market size slide is three lines:
- TAM: $X billion — "All companies that spend on {category} globally."
- SAM: $X million — "The subset of companies that fit our ICP and are reachable through our channels."
- SOM: $X million — "What we expect to capture in year three based on our sales plan."
Below the numbers, show the bottom-up math. "10,000 companies × $50K/year = $500M SAM. 2,000 reachable × 10% penetration = $10M year-three revenue."
That's it. The slide should take 10 seconds to read and 30 seconds to explain. If it takes longer, it's too complicated.
Related: The Ask Slide: How to Present Your Funding Round Without Looking Desperate
Data references: DocSend pitch deck study (market size slide attention metrics), Sequoia pitch deck template (TAM/SAM/SOM format), YC Startup School (bottom-up vs top-down methodology).
Ready to see how your market size slide looks to investors? Upload your deck to Bullpen for a free AI-powered assessment across 7 investor categories.
Get weekly pitch tips
One email a week. Actionable advice for founders.
Upload your deck. Get scored in 2 minutes. Free. Try now →